Tools used for testing
Picpick

A full-featured screen capture and recording tool, Intuitive image editor, color picker, color palette, pixel-ruler, protractor, crosshair, whiteboard and more.
Lighthouse Report
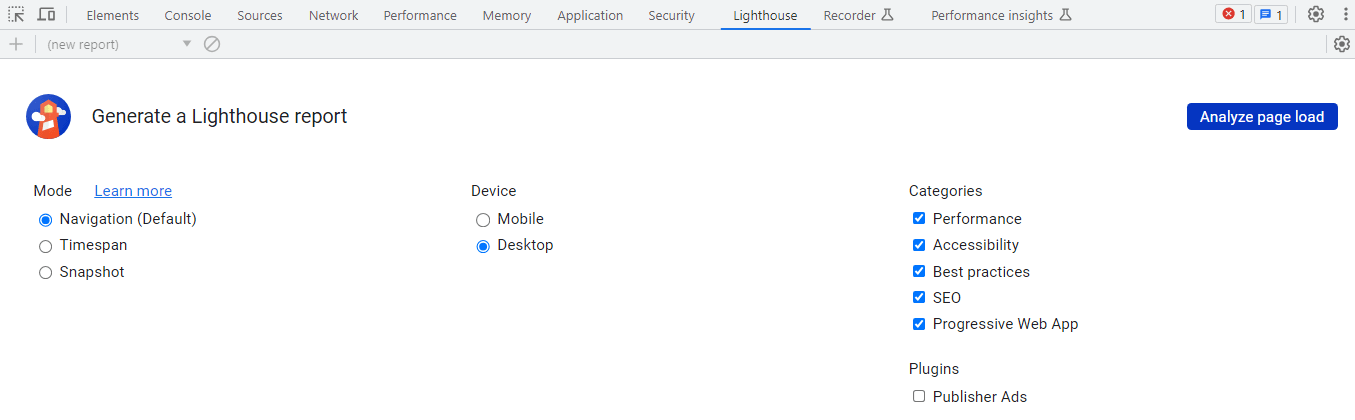
Google Lighthouse is an open-source, automated tool for measuring the quality of web pages. It can be run against any web page, public or requiring authentication.
Performance Analyzer
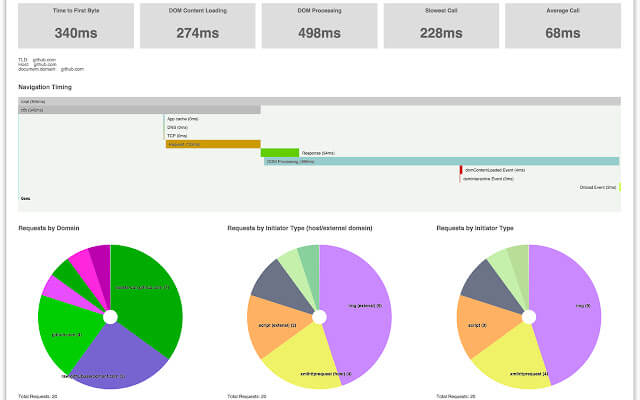
Performance Analyzer inspects and displays the duration necessary for updating or refreshing all visuals that user interactions initiate. It also presents the information so that you can view, drill down, or export the results.
EditThisCookie
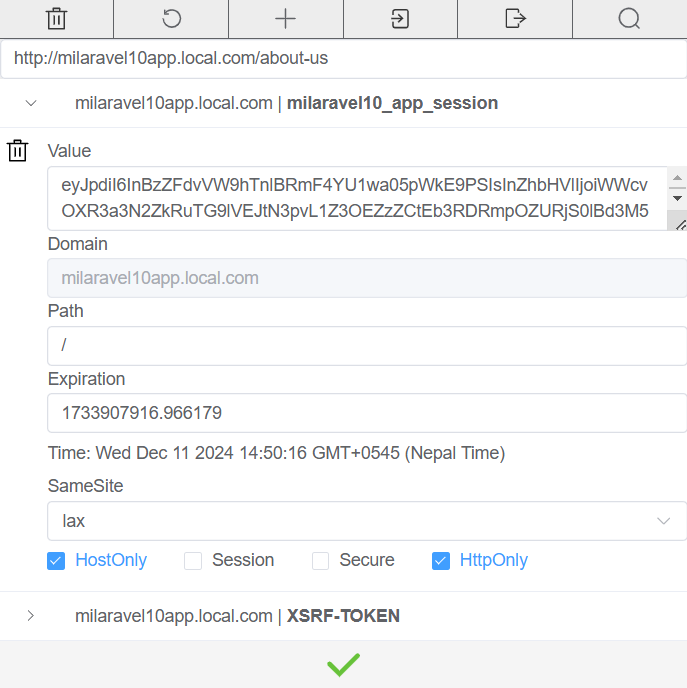
Editthiscookie is a chrome extension that allows you to quickly and easily edit your cookie preferences. It is fast, easy to use, and provides a simple interface that lets you change your cookie settings in just a few seconds.
Console
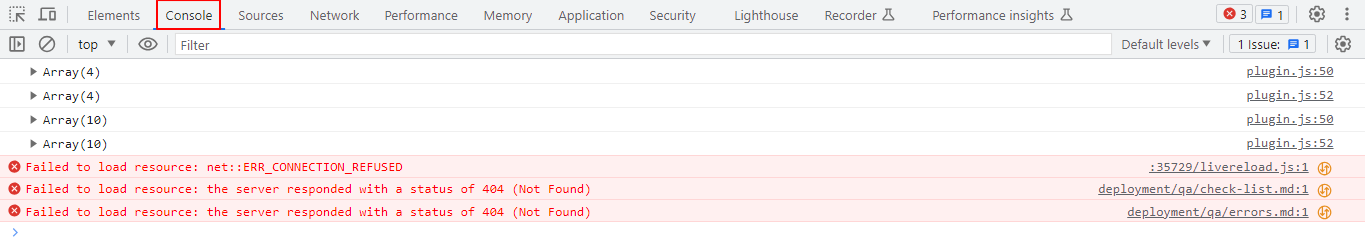
The chrome inspects element tool is considered to be a developer tool created to debug the website. F12, or Ctrl + Shift + I to open the Developer Tools.
Network
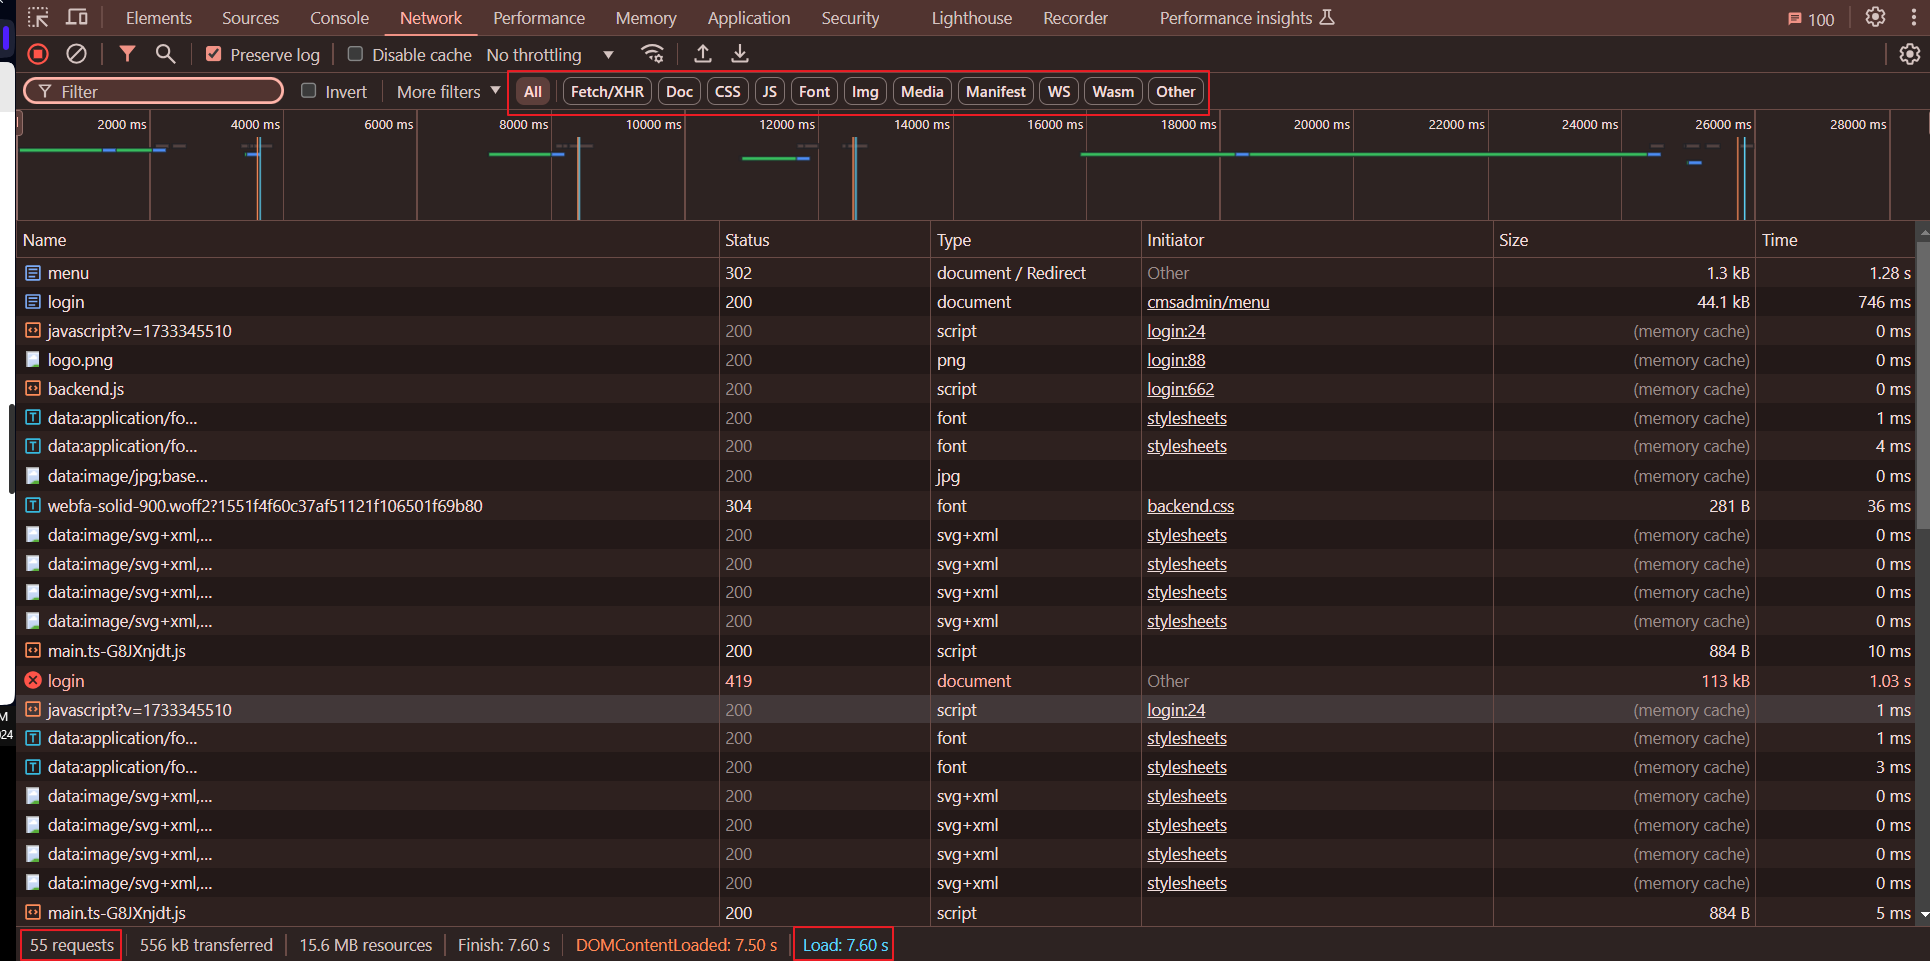
The Network view allows you to see and analyze the network requests that make up each individual page load within a single user's session. You can use this view to investigate the causes of slow pages and identify performance bugs.
Logs
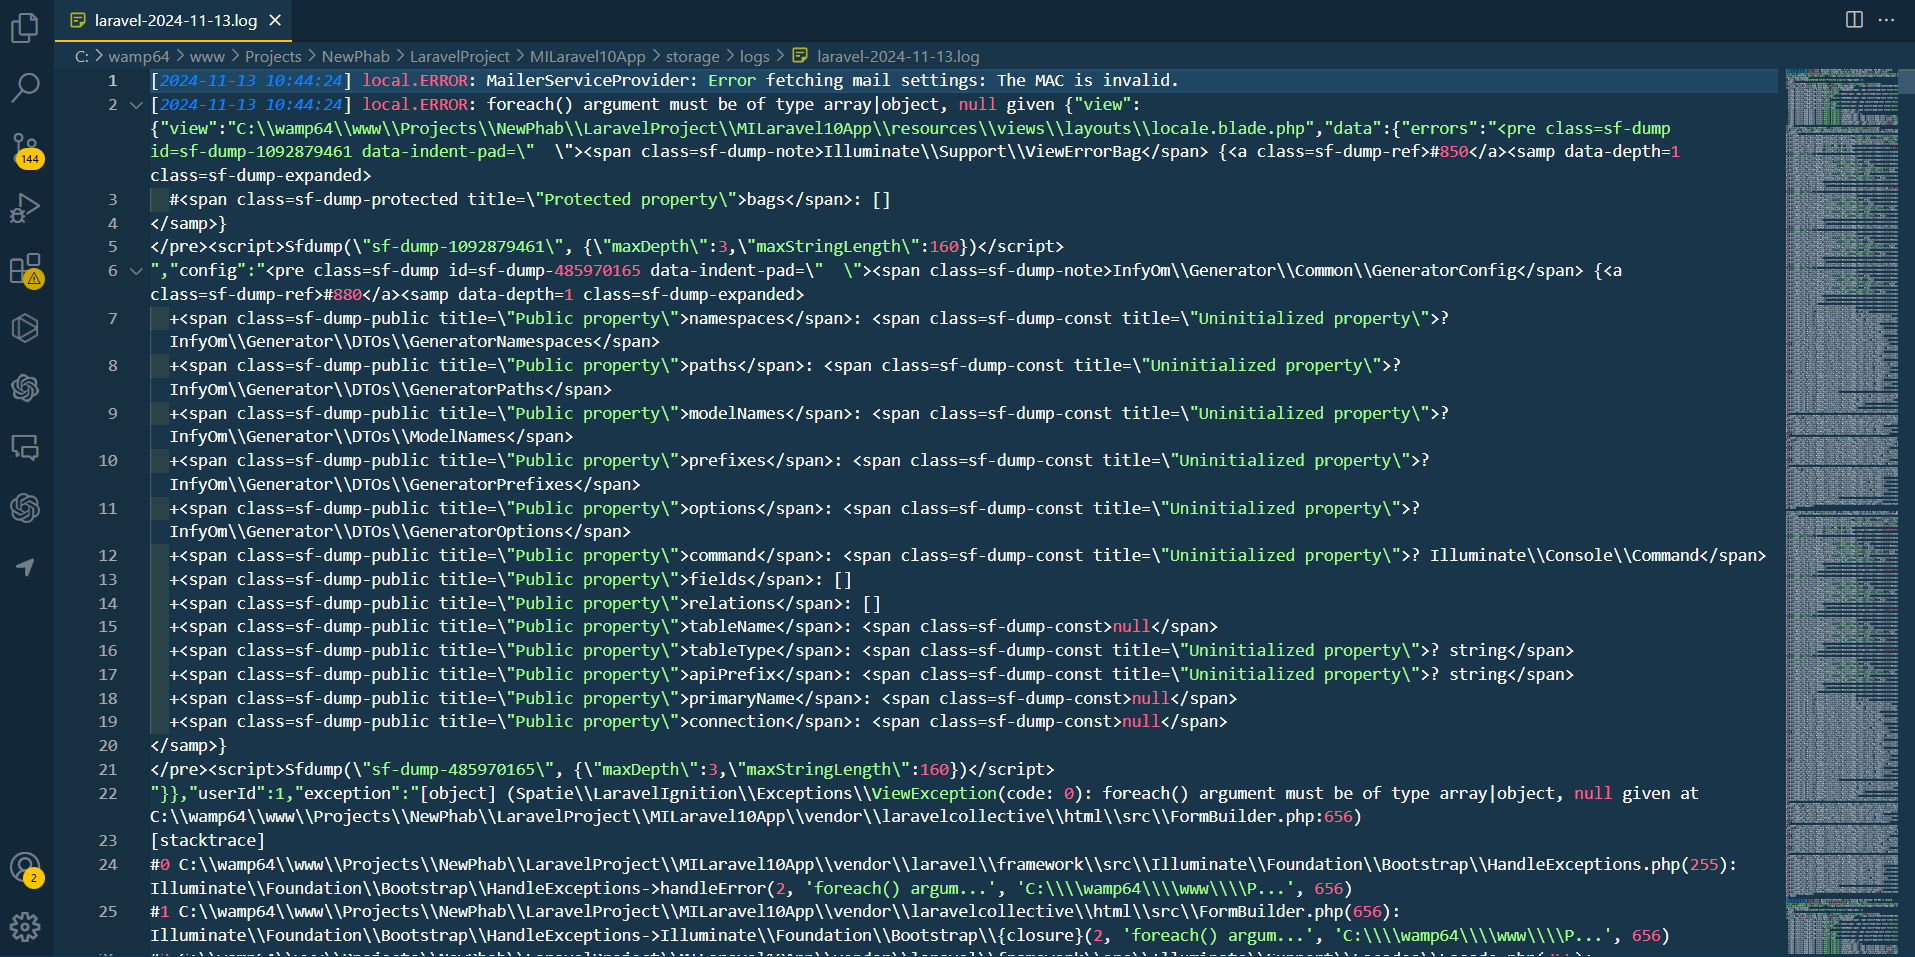
You can call the method log() to record a single log message. For convenience, a set of shortcut methods are provided for logging messages of various severity levels.
Server error log
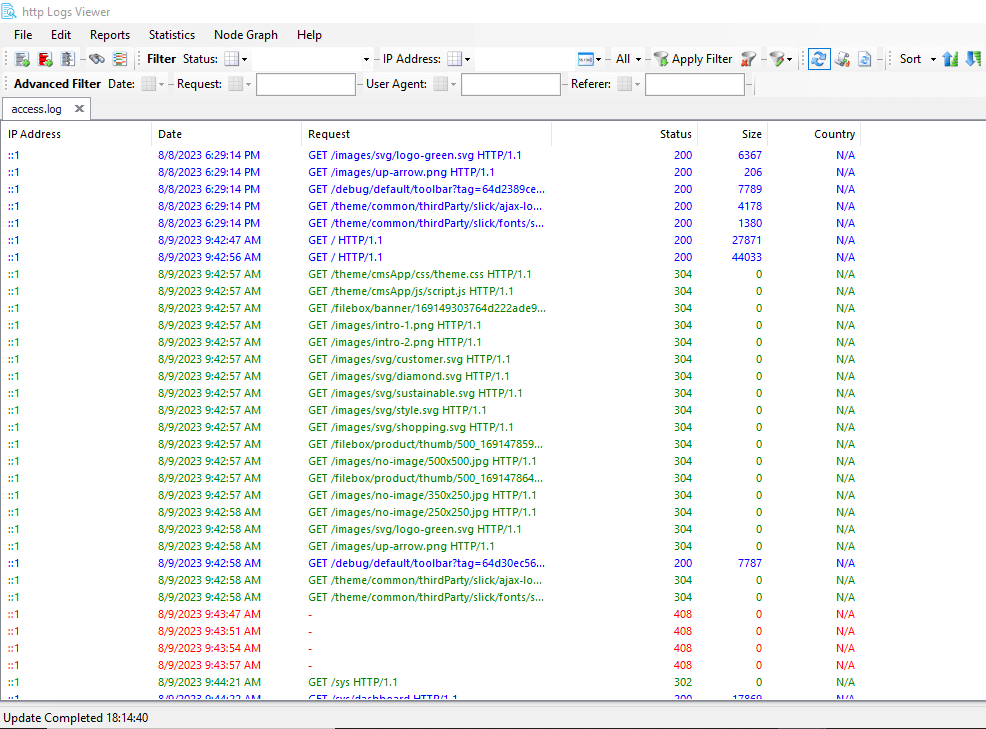
A web server log is a text document that contains a record of all activity related to a specific web server over a defined period of time.